N844X Checklists
March 3, 2015iPads at 25,000 ft
March 5, 2015This is very PRELIM performance for N844X.
This is a Lancair Evolution, with a (non-standard) PT-6-42 engine.
The engine normally used in the Lancair Evolution has 2 axial compressor stages, and puts out 750 hp.
The engine used in N844X has 3 axial compressor stages, and puts out 850 hp… and holds it higher.
This engine can deliver extra power and speed, but only at a cost of more fuel!
Below, we will look at a few prelim performance charts that I have gathered from testing my own plane, and see what the limits of the airplane currently are.
OK, first we look at SPEED.
These charts are identical to a regualr Lancair Evolution with 750 hp, up to about 285 knots or so.
The -42 just takes us up above 285 knots to 310 knots… at a significant cost in fuel, and therefore range.

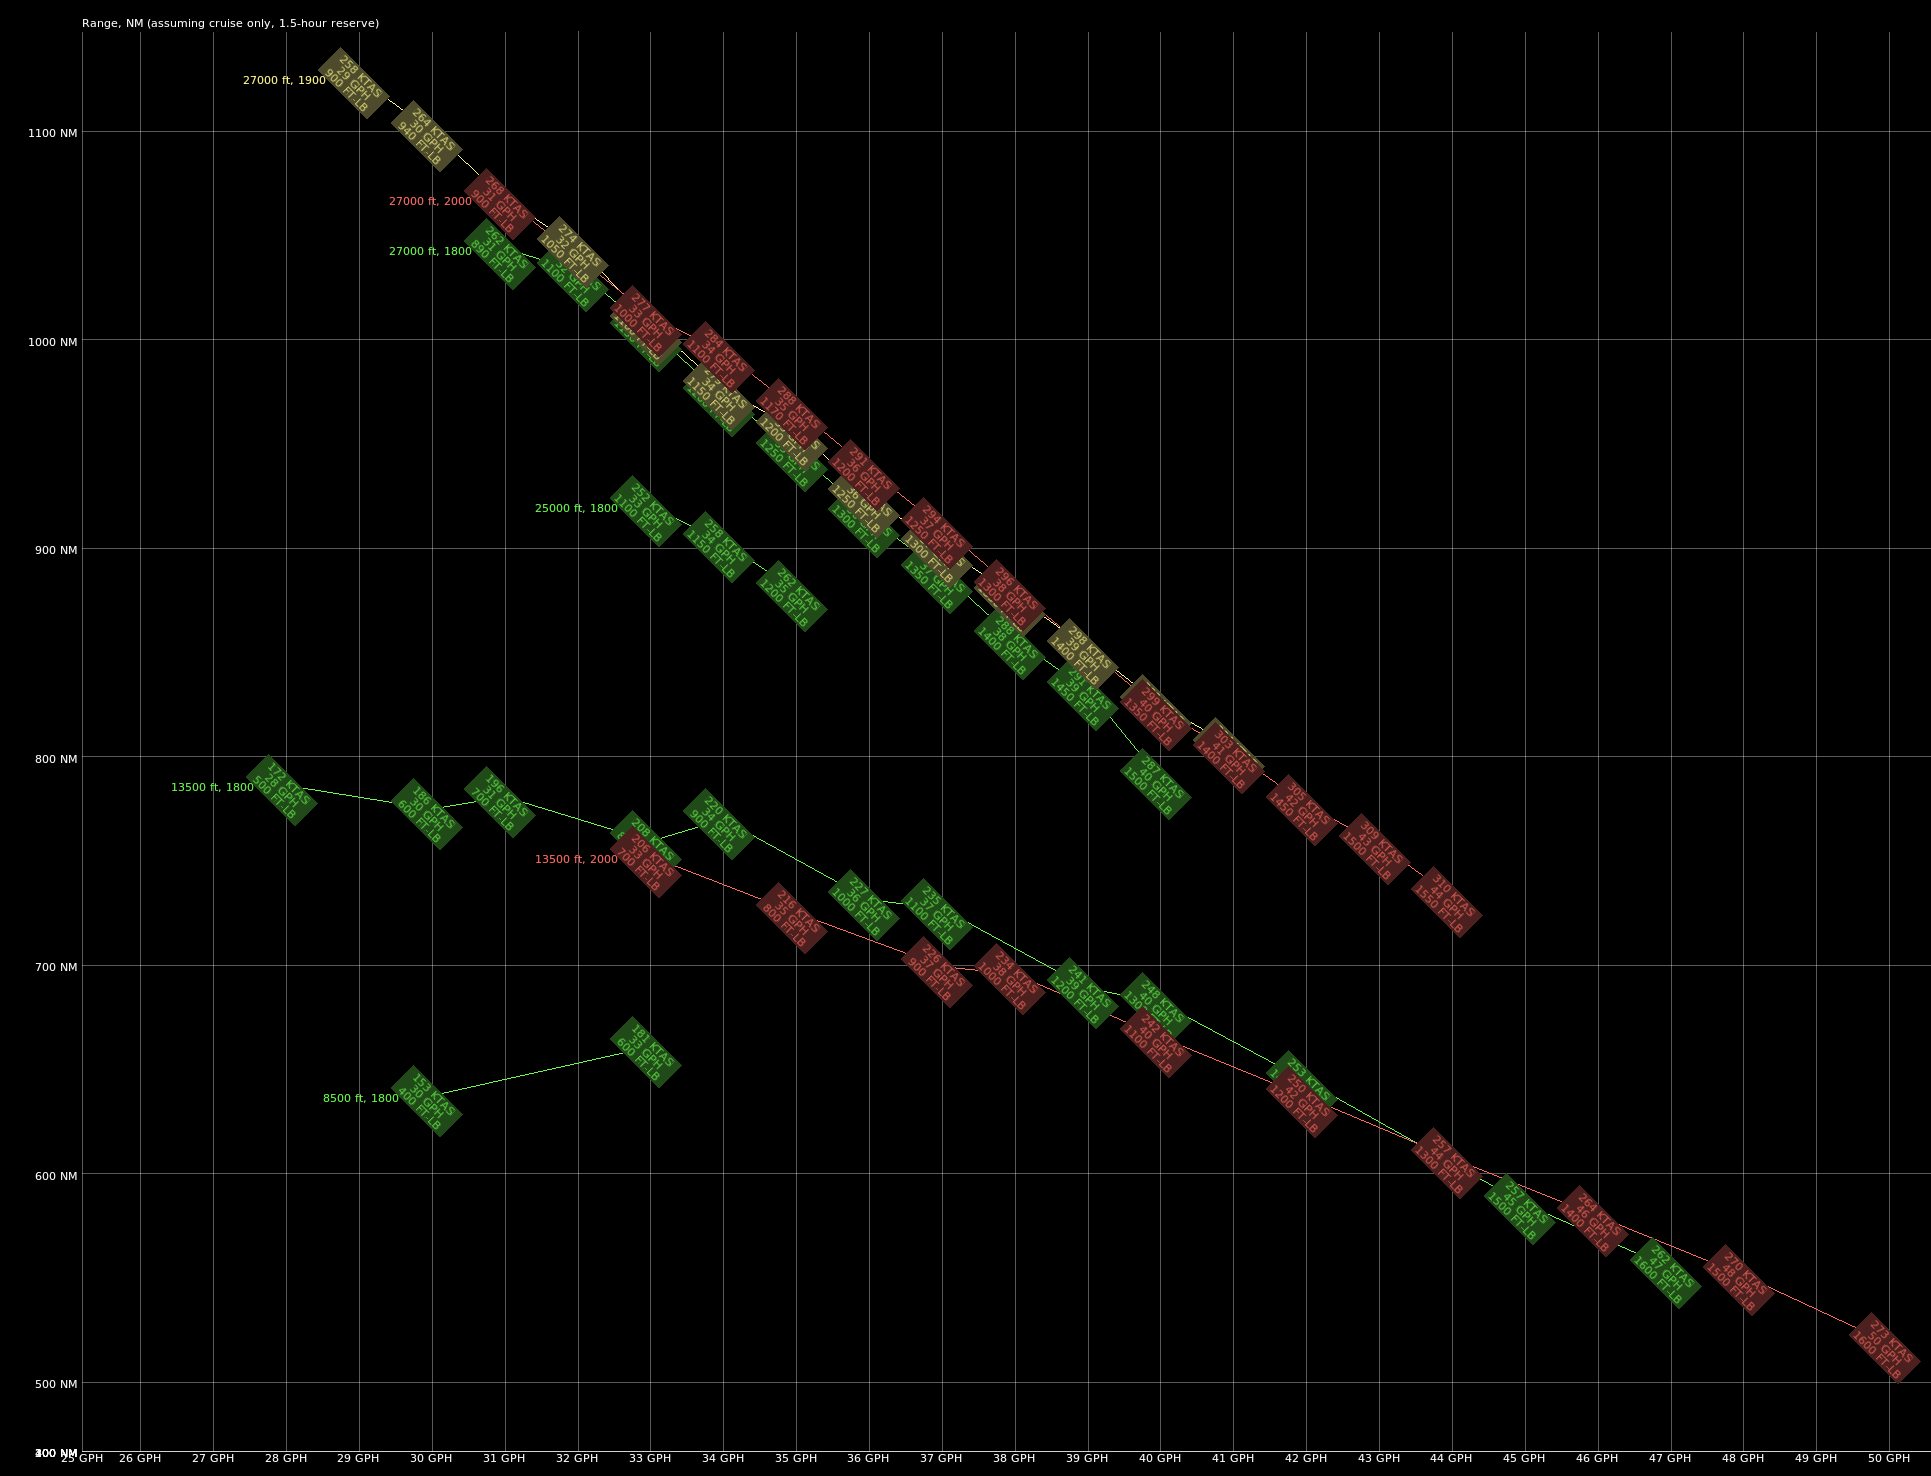
And now we see range.
As you can see, we get the best range if we SLOW DOWN!
So, the -42 engine does nothing for us in range… using its’ power puts us on the right side of the graph, which is clearly lower range!
Now here is what is interesting: The LOW end of the graph is limited by the PRESSURIZATION SYSTEM!
In all cases, I wanted to slow down more to really maximize that range, but when I reduced power, the pressurization was lost and the cabin started to lose pressure! This is because at lower power settings, the engine is simply not pressurizing that much air, so cabin pressure is lost. NOTE: The cabin if N844X might be unusually leaky! I will be looking at this moving forwards (The Evo designer and Lancair have both given me ideas for improving the leakiness of my cabin). But, for now at least, it is interesting that the RANGE of the airplane is clearly limited by the PRESSURIZATION SYSTEM, not the engine or aerodynamics or fuel capacity, since having a less-leaky cabin or stronger pressurization would allow me to throttle back more and get better range!
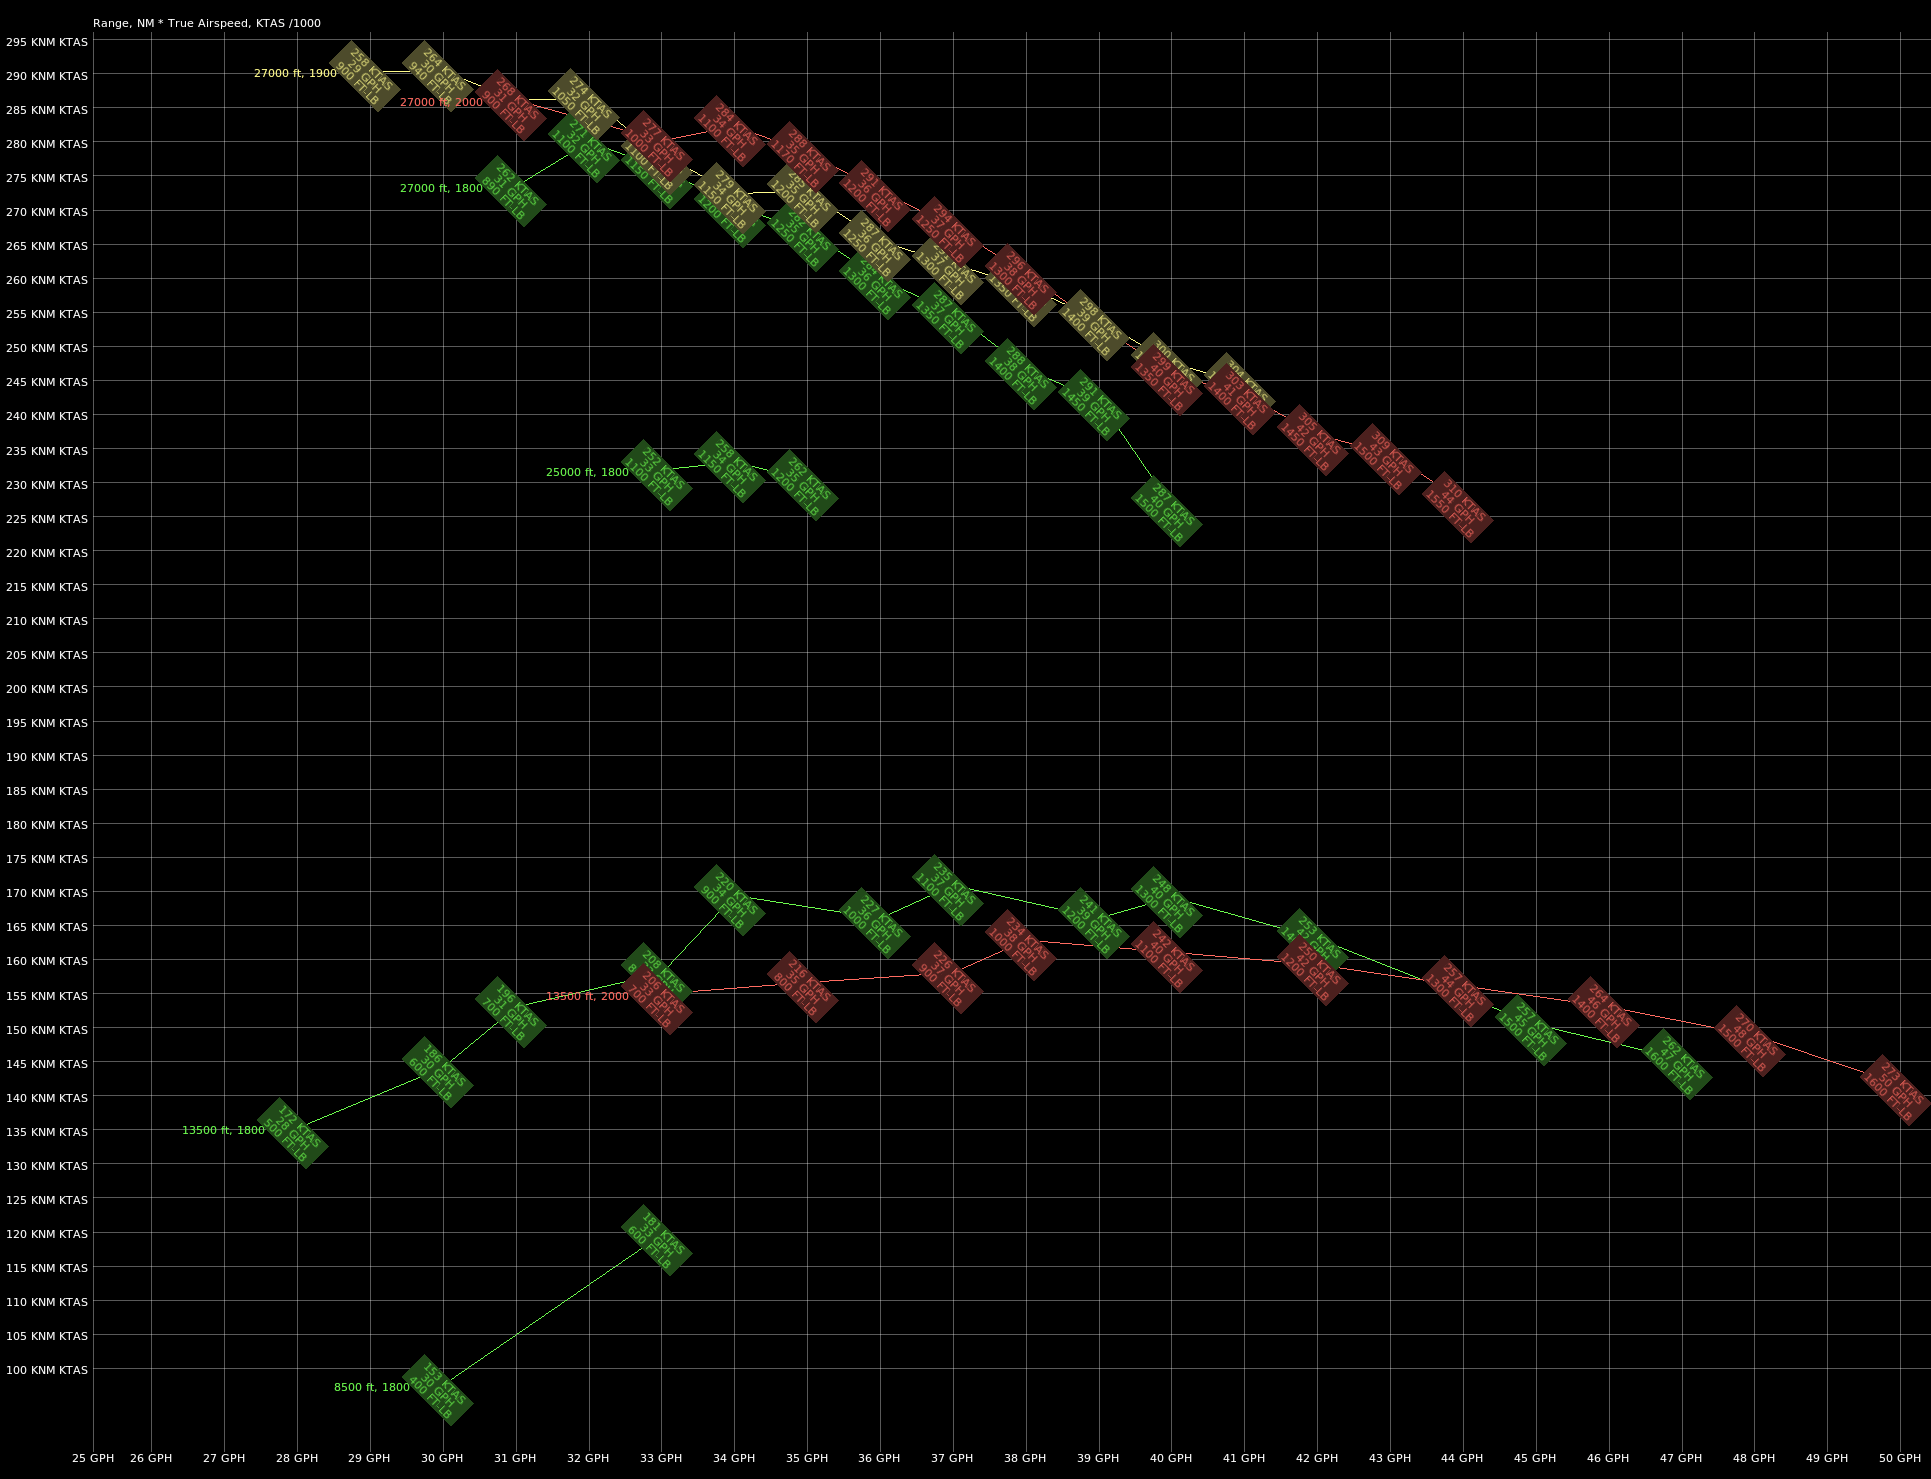
And now, the “Figure of Merit”, which for me is simply speed TIMES range divided by 1000.
So, 300 knots for 1000 miles is a figure of merit of 300.
So, 300 knots for 200 miles is a figure of merit of 600.
So, 300 knots for 500 miles is a figure of merit of 150.
I chose speed times range for the figure of merit because it measures what we want an airplane to do: GO FAST AND FAR!
We can see from these charts that I would get a BETTER blend of speed and performance if I would JUST SLOW DOWN!
In other words, right now, the fuel cost (and therefore range cost) of speed up is so high, that you get the best BLEND of speed and range if you SLOW DOWN! (Remember, we are looking for the HIGHEST point on the chart to get the BEST multiple of speed times range, which is a blend of both of them).
So we want to slow down to maximize this figure of merit, but the pressurization system (or leaky cabin!?) will not allow that without losing cabin pressure!
So, it turns out that to maximize SPEED TIMES RANGE (a reasonable figure of merit for an airplane, I would say), the REAL solution is not a bigger engine… the real solution is a better pressurization system! That is NOT what you would expect, is it? But, it has turned out to be the case! Weird! When I get a chance to try to find the leaks in the cabin (hint: This involves putting smoke bombs inside the cabin! :-O ) I will update my blog to indicate if we could find any leaks, solve them, and then expand this performance chart to lower speeds to maximize the speed times range!