
Now, COPYRIGHT trolling
May 12, 2021Sigh.
June 9, 2021From studying the loss of N515DL, I have learned some things about how ice affects aircraft performance.
================================================================================
THIS REPORT
================================================================================
I have learned some things about how ice affects aircraft performance from studying the loss of N515DL, a Lancair Evolution recently lost in flight with all aboard.
No privileged or private information will be discussed in this post.
================================================================================
THE MATH: WHAT ICE DOES
================================================================================
So let’s start with what makes airplanes fly: Coefficient of lift and Coefficient of drag.
Lift is equal to the coefficient of lift times the wing area times the air density times the airspeed squared divided by two.
Drag is equal to the coefficient of drag times the wing area times the air density times the airspeed squared divided by two.
TLDR:
Lift is equal to the lift coefficient times a bunch of stuff.
Drag is equal to the drag coefficient times a bunch of stuff.
As we know, we get more lift coefficient by raising the nose.
Now what does ice do to lift and drag?
All the aviation media in the world tells us that ice decreases lift and increases drag.
Too bad they’re all wrong.
For a given non-stalled angle of attack, ice does NOT reduce your lift much at all!
What ice does is far, far, far more dangerous than that: It secretly raises your stall speed.
A lot.
Then it makes it nearly impossible to recover from the stall that it just ambushed you with.
Here’s how I know:
Observe this report:
https://www.sciencedirect.com/science/article/pii/S100093611630019X
In this report, people carefully measured the effect of ice on lift and drag.
I show you some excerpts below.
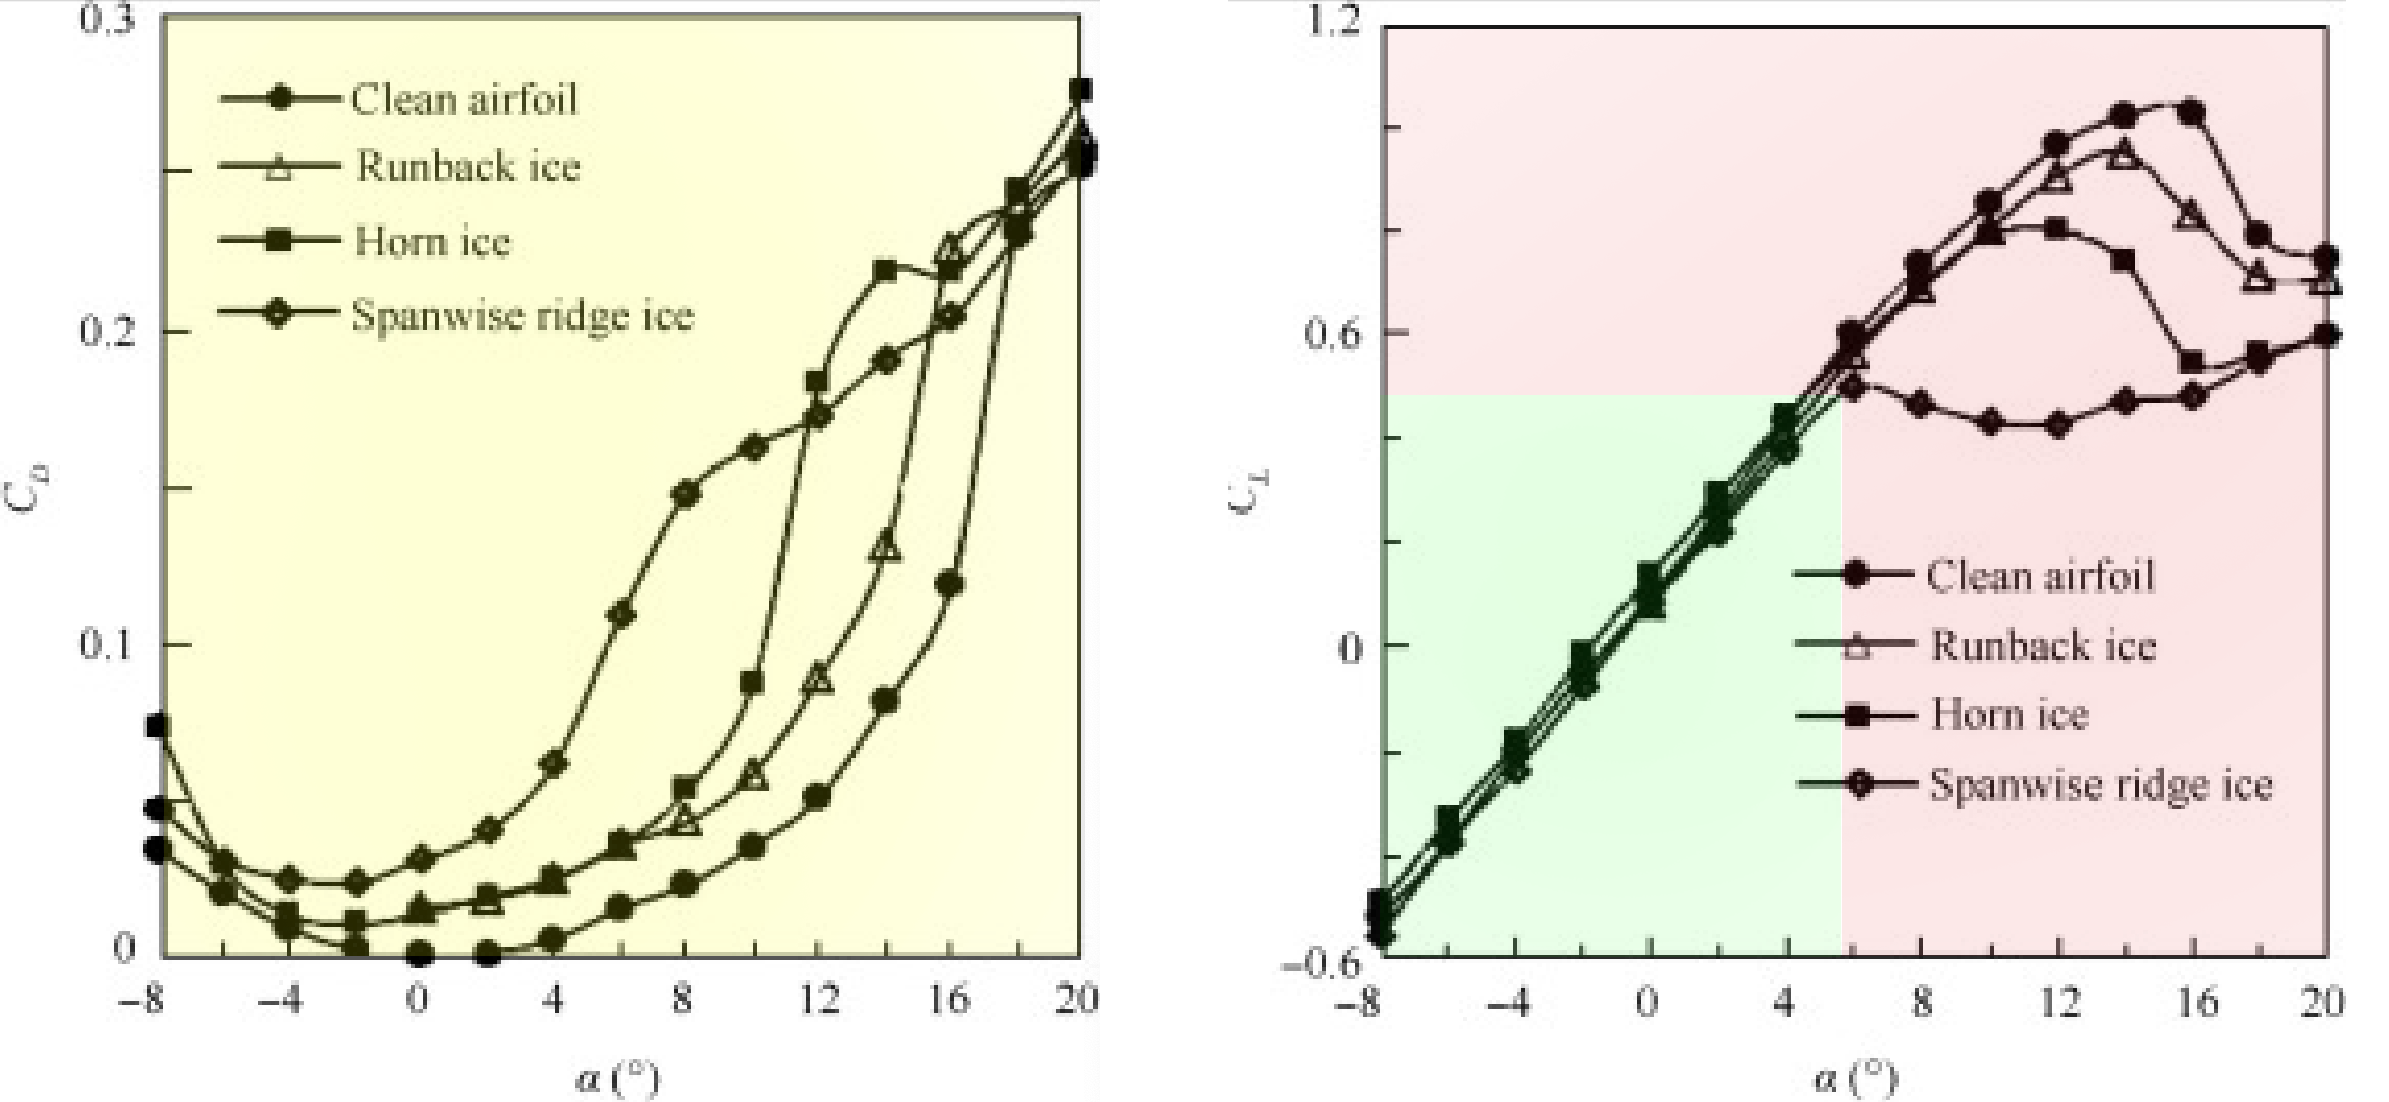
DRAG is LEFT chart.
LIFT is the RIGHT chart.
X-axis is angle of attack, Y-axis is coefficient of drag on the left, and coefficient of lift on the right.
You can see the drag coefficients increase as ice is added to the wing.
I’ve colored that area yellow: For ALL flying angles of attack, as the ice builds, the drag increases… a lot.
You slow down. I colored the whole region is yellow: You are slowing down a lot with ice on the plane, with all that drag!
Now let’s look at the effect ice has on LIFT at right.
As you can see in the GREEN area (up to about 6 degrees AOA), ice has VERY LITTLE IMPACT ON YOUR LIFT!
It would be very very easy to not even NOTICE it! The clean and iced wing have basically the same lift in the green region!
But look what happens when you get to an AOA of a mere 6 degrees with ridge ice: Your plane stalls!
That’s the red area. A stall at a much lower AOA than you thought possible. The red area is an area you can never safely access with ice on your plane… you invite a stall.
So let’s do some math on this.
All of my calculations below are based on a hypothetical flight scenario for N844X, my personal Lancair Evolution.
Stall AOA for N844X with a clean wing, if we use the lift chart above for reference: AOA 15 degrees, Cl 1.05.
Stall AOA for N844X with a ridge-iced wing, if we use the lift chart above for reference: AOA 6 degrees, Cl 0.45.
So with ridge ice, N844X will stall at at 6 degrees instead of 15 degrees… THAT’S LESS THAN HALF OF THE USUAL THE ANGLE OF ATTACK.
Specifically, N844X will stall at 6/15 = 0.40 = 40% of the usual angle of attack… a 60% reduction.
What does that equate to in knots?
I will show my work:
Cl when clean = 1.05 (normal typical max coefficient of lift,from the science direct article, shown in the chart above)
Cl when iced = 0.45 (iced max coefficient of lift from the science direct article, shown in the chart above)
k = one half times wing area times air density, a constant for any given moment in a flight in a given airplane.
lift when clean = 1.05 * square ( Vstall-clean ) * k (see my equation for lift at top of report to see where this comes from)
lift when iced = 0.45 * square ( Vstall-iced ) * k (see my equation for lift at top of report to see where this comes from)
We have the same lift in both cases, since we are holding the plane at altitude in both cases, so, lift when clean = lift when iced, the autopilot sees to that by raising the nose
so: (just running through the algebra so my work can be checked)
square ( Vstall-iced ) * 0.45 * k = square ( Vstall-clean ) * 1.05 * k
square ( Vstall-iced ) * 0.45 = square ( Vstall-clean ) * 1.05
square ( Vstall-iced ) = square ( Vstall-clean ) * 1.05 / 0.45
Vstall-iced = square root ( square ( Vstall-clean ) * 1.05 / 0.45 )
Vstall-iced = Vstall-clean * square root ( 1.05 / 0.45 )
Vstall-iced = Vstall-clean * 1.53
In other words, for the ridge-ice case above,
IF the lift chart above is correct for a given airplane,
THEN you can take the clean stall speed of any airplane and add 53% to it: That will be your actual stall speed.
================================================================================
APPLY THE MATH TO N844X, MY LANCAIR EVOLUTION
================================================================================
The clean stall speed in my beloved N844X is 76 knots indicated.
So the stall speed with ridge ice is, without question if the chart above is correct:
76 * 1.53 = 116 knots indicated.
My stall speed with ridge ice is 116 knots indicated.
Higher than my calibrated white-arc stall speed.
Higher than my best rate of climb speed.
Higher than my best glide speed.
Higher than my AOA calibrated stall-warning speed.
Higher than my autopilot underspeed-protection speed.
The stall speed with ridge ice is well within the speed range I would expect to safely operate the airplane.
The stall speed with ridge ice is higher than the speed I would use for stall recovery if I was stalled.
And if I fly AOA instead of speed, my stall is 6 degrees AOA when I expect it to be 15.
If I stalled, I might lower the nose to half the expected critical AOA: See the chart above: I would still be stalled.
If I stalled, I might lower the nose to best climb or glide speed to minimize drag: See the chart above: I would still be stalled.
My expected stall recovery procedures, aren’t.
================================================================================
APPLY THE MATH TO 515DL, BASED ON PUBLICLY-AVAILABLE X-PLANE AND FLIGHT-AWARE
================================================================================
So let’s look at 515DL with only the publicly-available flight-aware data.
FlightAware clearly shows that he slowed down gradually at FL250 before an in-flight break-up.
Why?
Let’s look at his deceleration.
As we probably already know, when we are going really fast in an airplane and we suddenly reduce power, the airplane slows down A LOT AT FIRST SINCE THE DRAG IS HIGH, and the slows down less and less the slower you go, as the drag comes down.
This is called an ASYMPTOTIC deceleration: The speed is getting asymptotically closer to its’ new terminal value.
The airspeed falls quickly at first, and then levels out with a more gradual deceleration as the drag reduces as the airplane slows.
So, for a sudden power reduction, the plane would slow rapidly at first, and then gradually level off at some new, lower speed.
As we probably already know, when ICE builds on an airplane, the OPPOSITE happens: At FIRST your decelerate just a LITTLE BIT… there is only a LITTLE BIT of ice on the airplane!
Then, over time, as the ice builds, the deceleration increases… deceleration is proportional to drag, and drag is driven by ice as we see in the drag chart above.
So the deceleration INCREASES over time, which means that the speed bleeds off AT AN INCREASING RATE! This is the shape of a parabola. I’ll call it parabolic deceleration.
Isn’t this interesting?
515DL may have been slowed by a power-reduction, or an ice accretion, and:
A sudden power reduction would slow quickly at first in high drag, then decelerate more gently as terminal velocity is approached.
A constant-rate ice application would slow slowly at first with little added drag, then decelerate more quickly as more ice is accreted.
So I set up both cases in X-Plane, flying my Evolution N844X in the sim.
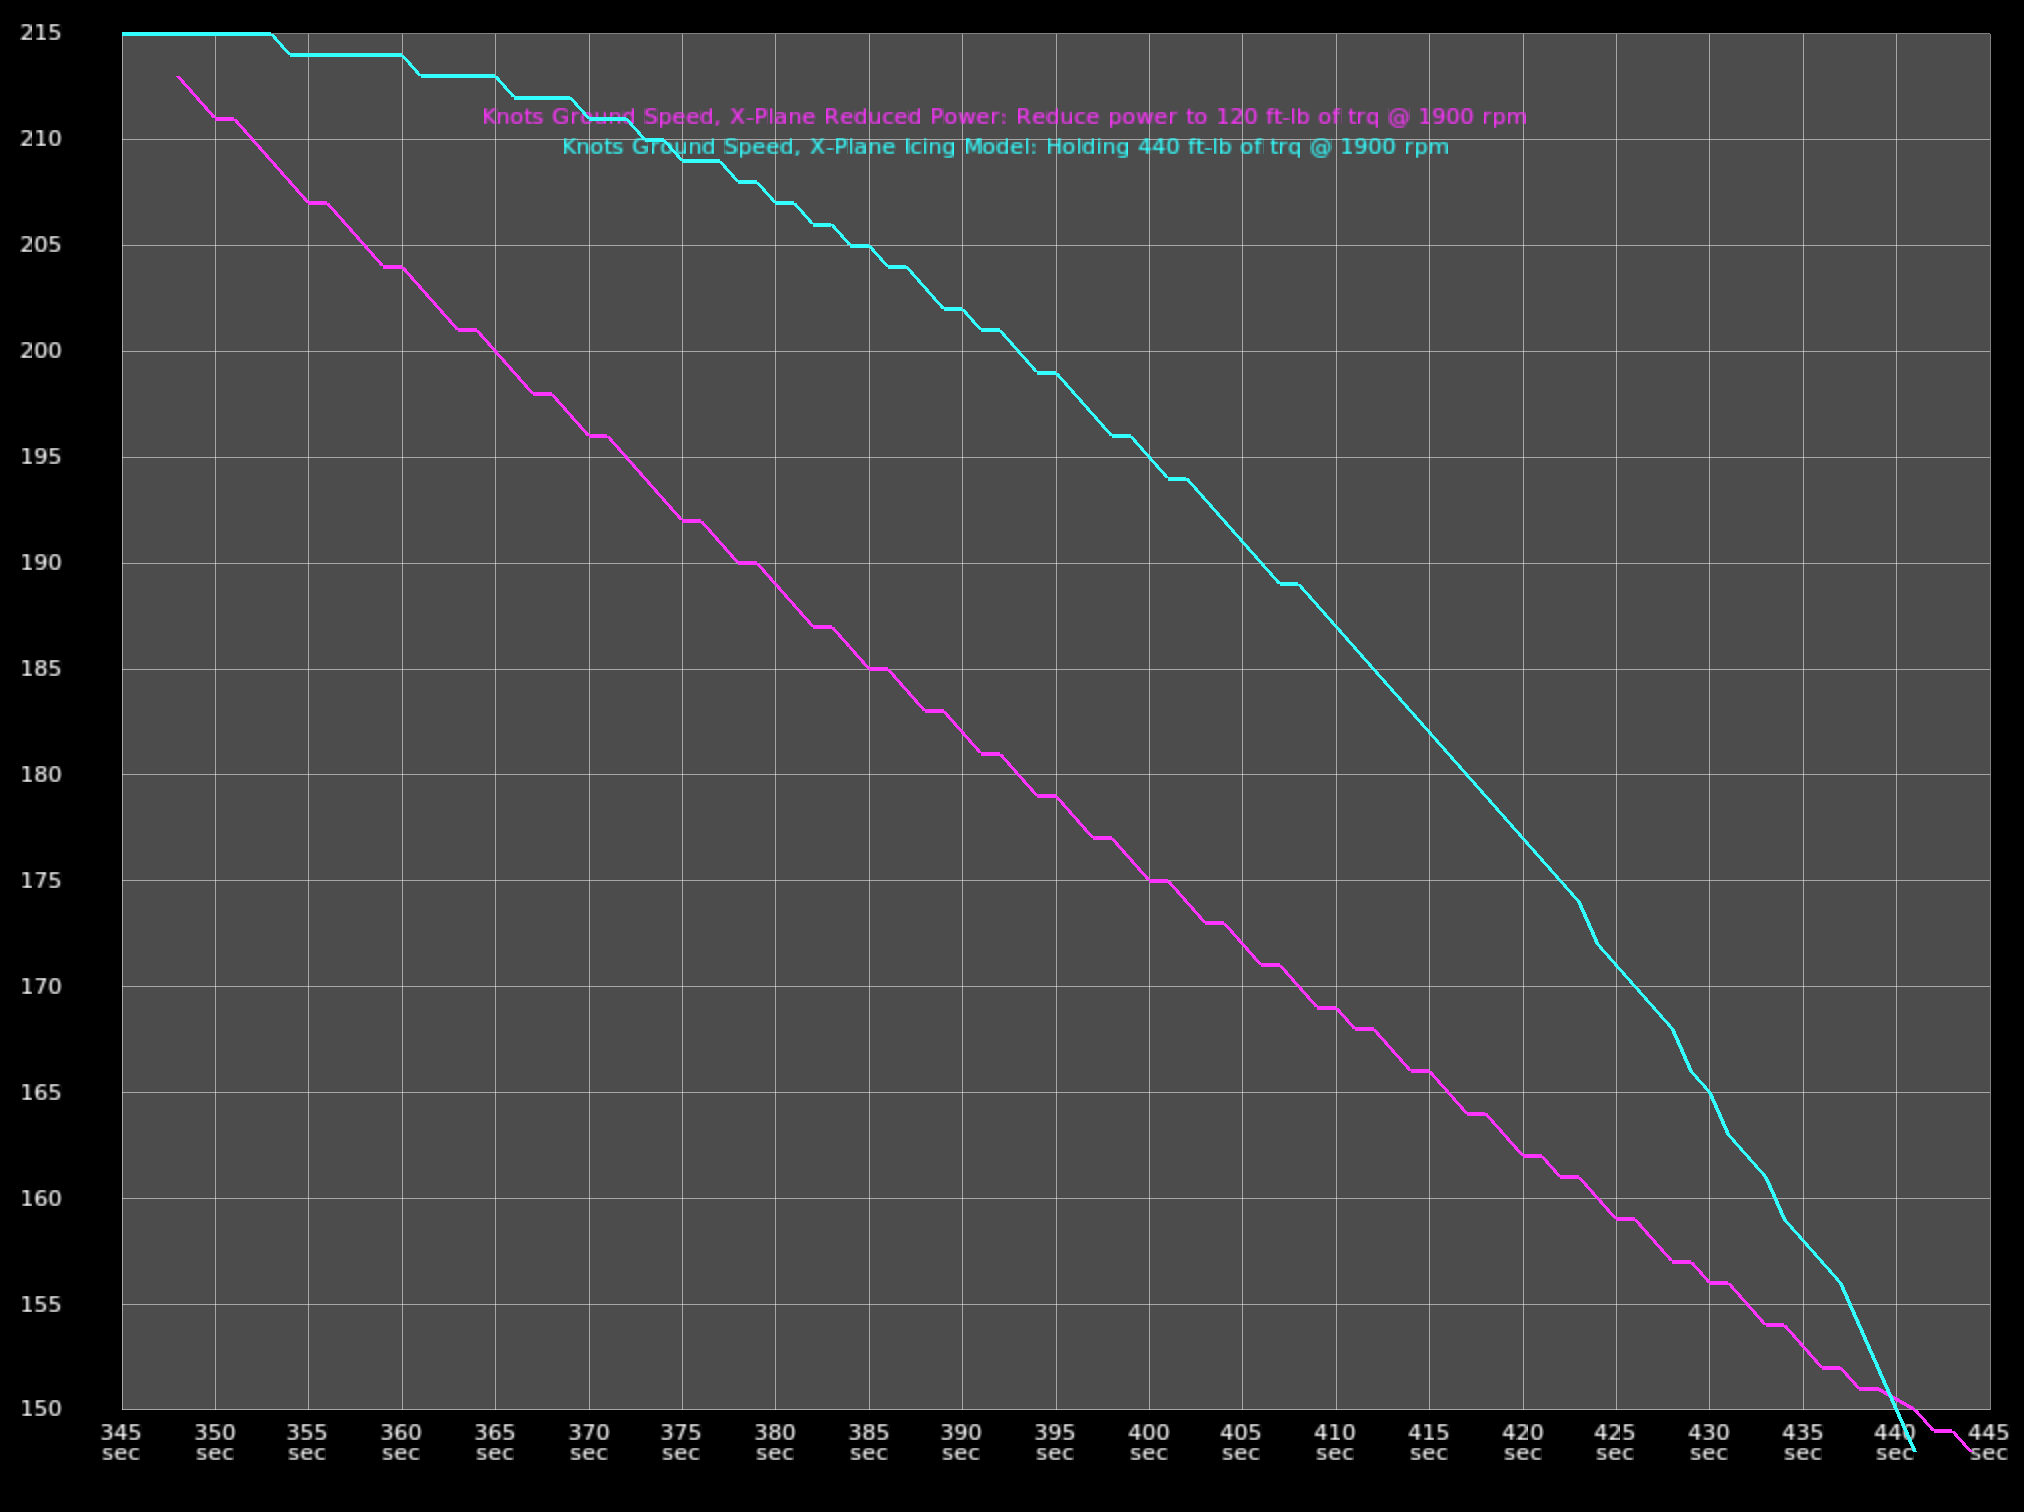
Here are both plots, shown as recorded in X-Plane:
Y-axis is knots, X-axis is time into the flight in seconds.
The MAGENTA line is the speed over time observed by just pulling the power back. This is the asymptotic line. As you can see, it slows down a bit quicker as the start in the higher drag, and then slows down more gradually as the speed bleeds off, as airplanes do. The line is asymptotic.
Then, the CYAN plot was obtained by having X-Plane apply ice from ZERO ICE at the LEFT SIDE of the graph to NINETY PERCENT of the ice defined by the tables above at the RIGHT side of the graph.
As you can see, the cyan plot is parabolic: The deceleration is INCREASING over time as the ice builds on the airplane! Again, this is a simulation of my airplane N844X in my flight simulator X-Plane, not real-world data.
Note that I chose the power reduction and ice accretion rate to have the same known ENDPOINTS (215 knots ground speed at t=345 seconds, 148 knots ground speed at t=445 seconds)
So these are two different ways an airplane might slow down in flight.
Which one will flight-aware follow? The magenta line that shows a sudden power-pull and gradual deceleration, or the cyan line that shows a drag application that increases over time?
Here’s the publicly-available FlightAware data from 515DL.
This is miles per hour ground speed, and of course we are thinking about knots airspeed, so the correlation is rough,
but look at the deceleration from 250 mph ground speed to say 115 mph ground speed, and compare the shape of that curve to the curves above.
I’ve shaded that area in red in the fljght aware image below.
Which does it match more closely?
You can see that over time, the deceleration increases down to stall speed.
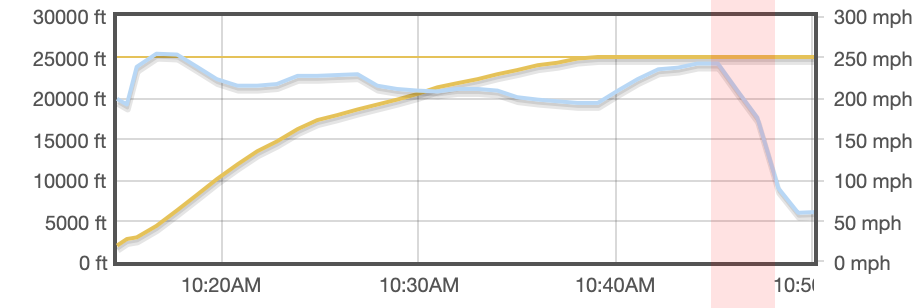
For the deceleration at the end of the flight, hilited in red, does this indicate to you that someone:
1: pulled the power and coasted down asymptotically to some new equilibrium speed (magenta),
or
2: had drag build up at a constant rate, causing the deceleration to increase at a constant rate, and show the resulting parabolic change in speed (cyan).
================================================================================
GENERAL-CASE DISCUSSION OF WHAT A PILOT MIGHT THINK IN ICING SCENARIOS
================================================================================
So what might go through a pilots’ mind in icing scenarios?
Cruising along on autopilot, and ice is encountered. Remember, everyone teaches us that ice increases drag and reduces lift. This is not really true. As we see from our charts above, ice ads a huge amount of DRAG, but does not have too much effect on lift… at first. And in fact, lift does not degrade at ALL, because as ice builds when on autopilot… the autopilot simply keeps raising the nose to MAINTAIN LIFT!!
So when on autopilot, ice does NOT degrade lift.. the lift remains un-changed, because the lift impact is small, and the the autopilot even hides that from you by raising the nose.
Ice instead causes the airplane to SLOW and the autopilot raises the nose… with the critical AOA cut in HALF!
You can see where this is going.
A slowing airplane with a gradually-raising nose and the critical AOA being cut in half has an obvious and inevitable result:
The autopilot will fly the airplane right down some speed at which the stall will happen (remember it happens at LESS THAN HALF the usual AOA, which is A 53% higher indicated airspeed)
But what about the pilot noticing the airplane is slowing down?
How could he? As the autopilot raises the nose to maintain level flight, the pilot is pushed back more and more in is seat… that feels like an ACCELERATION to me!!!
It feels like the plane is SPEEDING UP! He feels like the plane is going fast, not slow!
But what about autopilot underspeed protection?
It’s useless: The stall speed of an airplane with 90% of the ice demonstrated above is greater than the usual best GLIDE speed… certainly within the underspeed limit of any properly-configured autopilot!
Who expects the stall speed to be above best glide speed?
But what about the pilot understanding the stall?
How could he? A pilot in that case is already known to be in IMC, and the PFDs we use are not usually the ones that are designed to show extreme attitudes.
But what about the pilot recovering from the stall?
How could he? He’s IMC, just taken over a stalled airplane, and the plane is now stalling at HALF the usual AOA, STALLING ABOVE BEST GLIDE speed… how could any trained stall recovery technique even APPLY here?
So we THOUGHT that:
Ice reduces lift. (It doesn’t. it has little pre-stall effect on lift, and the autopilot raises the nose to hold altitude… the autopilot is literally maintaining an un-changing lift)
Autopilots keeping us from stalling with underspeed protection. (They don’t. Your stall speed is now much higher than we ourselves programmed into our autopilots)
We will recover by reducing AOA to less than 15 degrees or so. (We won’t. We now stall at less than half the AOA we trained)
We will recover by increasing speed to well above stall speed under 1G. (We won’t. Our stall speed is now above the best glide speed and the best rate of climb speed)
================================================================================
HYPOTHETICAL POSSIBLE CASE IN N844X, MY LANCAIR EVOLUTION, SOME DAY
================================================================================
Now, like I do every time I read an accident report, I will mentally put myself in this situation in my beloved N844X.
Some day in the future, maybe I’m flying along in the clouds.
Of course the autopilot is on, holding altitude with any pitch input required.
Of course 90% of my thinking is strategic, looking at weather, fuel, engine parameters, etc, not staring at the attitude indicator for subtle changes in pitch!
Ice starts to form on the airplane, which of course does NOT show on my avionics, which I am studiously observing.
The airplane slows from the huge drag, shown in the yellow region of the drag chart above.
As the plane slows, the autopilot does exactly what it’s supposed to: Raise the nose to hold altitude. Total lift remains equal to total aircraft weight.
As the nose comes up, I am pushed back in my seat more from the nose-high altitude: Feels like acceleration to me, not deceleration. I think we are going FAST! I love speed. I’m totally comfortable.
At some point, the autopilot has me down to 116 knots (well above its’ 110 knot underspeed limit, so no underspeed-limit is hit) and up to 6 degrees AOA.
The autopilot may think there is no problem: I am well above glide speed.
The AOA system thinks there is no problem: I am well below the normal stall AOA.
The airspeed indicator thinks there is no problem: I am well above stall speed, and even glide speed!
The attitude indicator thinks there is no problem: My nose is up a little, but not nearly enough to worry about a stall with a clean wing.
But as you see from the charts above, at that point, I stall.
I am in IMC at this point of course.
The autopilot may keep pulling back on the stick, in the stall, thinking the speed and AOA are fine.
I am so cool and collected that I turn the autopilot off and fly the stall recovery myself. I lower the nose to reduce angle of attack to 7.5 degrees… HALF my usual critical AOA.
No good. You know that my stall AOA is now 6 degrees.
I am so cool and collected I lower the nose to increase airspeed. I go to 110 knots, my best climb speed.
No good. You know my stall speed is now 116 knots. (and that’s assuming my normal weight at 1G… neither of which is true as I carry pounds of ice with rapidly-increasing speed and G-load)
I am now in IMC, in a stalled airplane that I just grabbed from the autopilot, with a critical AOA that is less than half of what all of the systems on board are calibrated for, with a critical AOA that is less than half of what I have trained for, with G-loading and speed building up in post-stall flight, perhaps with multiple stall recoveries and re-entries since the stall AOA is now so low.
At some point, the speed surely exceeds maneuvering speed, and I am perhaps pulling back on the stick trying to recover at an increasingly-high speed. No airframe can take that forever: At some point the G-limit is exceeded and the wing fails.
The post-flight observed result would be a constant-altitude parabolic speed-loss on flight trackers and and in-flight break-up.
================================================================================
GENERAL-CASE DISCUSSION OF WHAT A PILOT COULD DO IN SCENARIOS LIKE THIS
================================================================================
For me, personally, I will do this:
Job 1: ALWAYS SEE IF THERE IS ANY ICE ON THE AIRPLANE
If there is, I just got a new Job 1!
Job 1: (TACTICAL): KEEP MY ANGLE OF ATTACK DOWN AND MY SPEED UP. (Look at the green area on the coefficient of lift graph above).
Job 2: (STRATEGIC): Get out of icing conditions.
OK it has been a stressful several days going through all this, but the next major X-Plane update will have this icing model implemented.